Profiling a Go-language Production Server
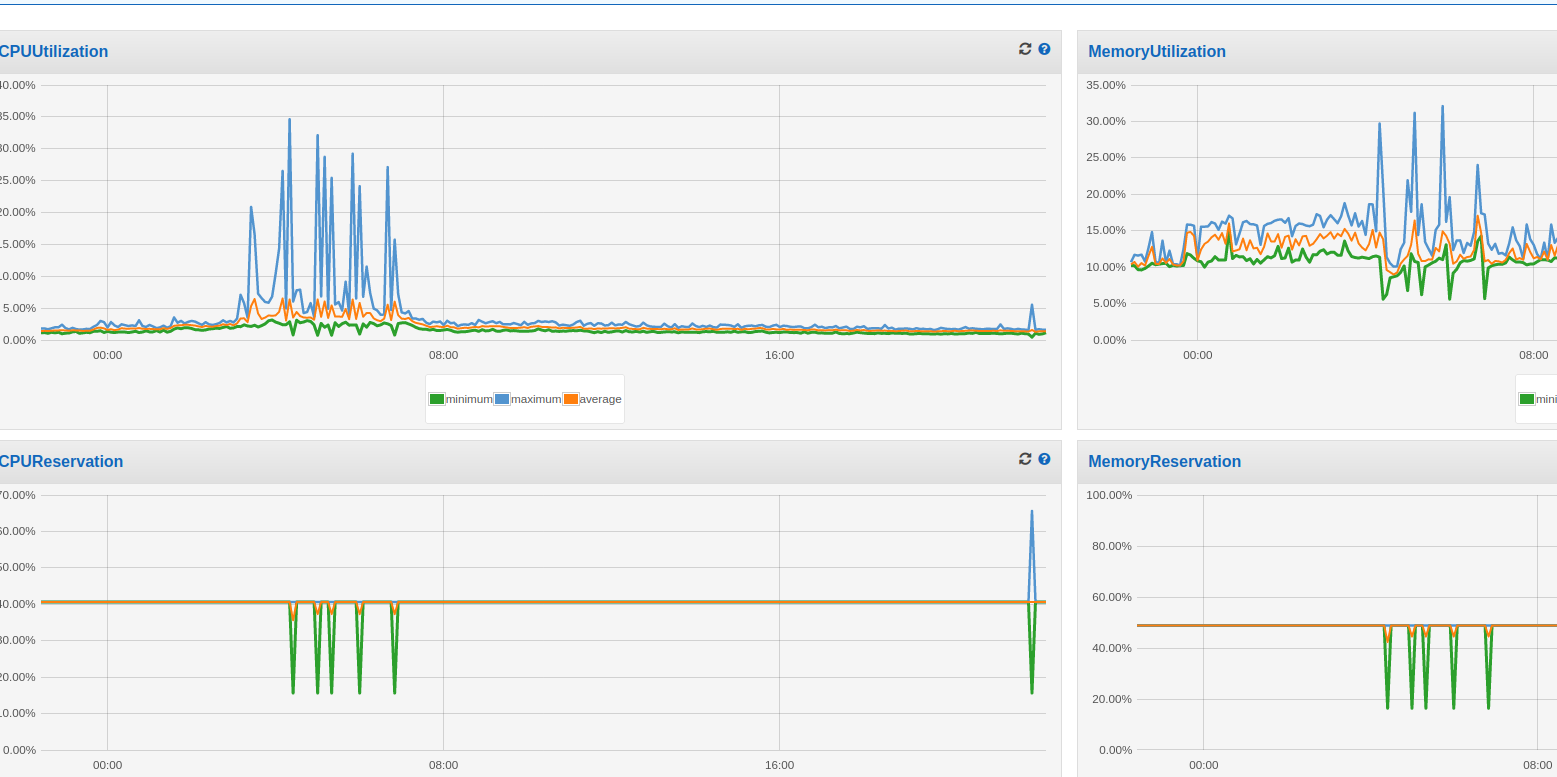
A few months ago, I noticed that my open-source crossword board game website Woogles was having CPU spikes while running tournaments. Specifically, at the beginning of every tournament round, the CPU would spike a bit in ECS; memory would also spike, although not as dramatically. The image below shows an example. Notice the periodicity - roughly every 30 minutes, which is around the cadence of most of our tournament rounds.

Eep! This isn’t good, right? The spikes were not as dramatic when I first noticed them several months ago, so I logged it as another issue to fix (hey, if you’re interested in helping us, we’re a registered non-profit who are trying to make competitive word games accessible to everyone!)
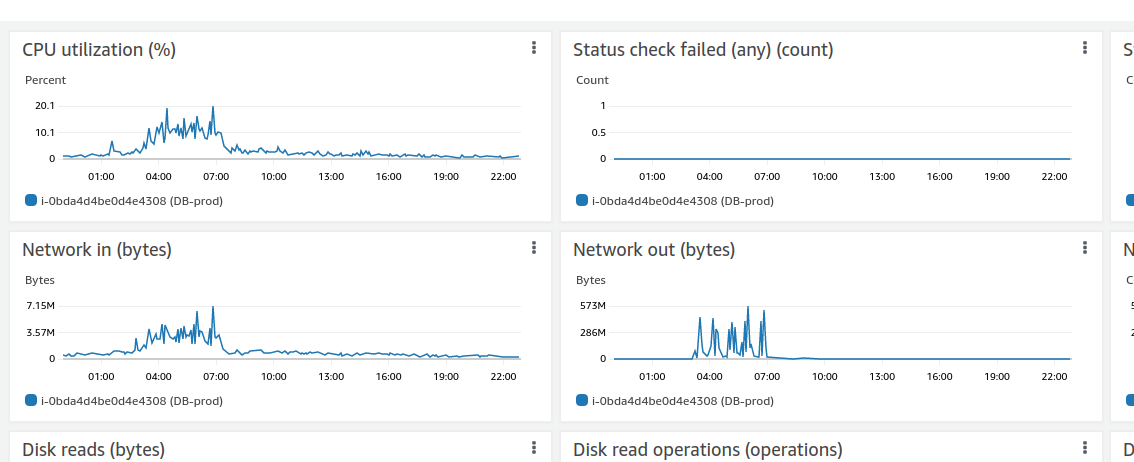
The database also is not doing too great:

Network out shows hundreds of megabytes being transferred via the network. How is this possible? Our tournament representation could admittedly be more efficient, but these aren’t huge tournaments – most of them average around 20-30 players. I even saw some spikes for a small 8-person tournament.
Things came to a head when during a 60-or-so person tournament, the server straight up restarted a few times at the beginning of rounds. It looked like ECS had OOM-killed the service. At this point this issue became top priority, and we resolved to fix it. We were in the middle of creating a new feature (puzzle mode!) so the task fell to me to rewrite what I thought was the bottleneck in tournament mode. Tournaments are largely represented by JSONB blobs in a Postgres database, and when a round starts, every player gets a “Ready” widget that they can click on to start the game. When they click this button, this “ready state” gets written and saved to the JSONB blob. My theory was that this was very inefficient and killing memory usage, especially if people refresh (and then become unready, writing that state as well, etc).

I quickly came up with a design and started rewriting this part of the app so that Ready States don’t get written to the blob anymore. However, first I wrote an integration test that simulated 200 tournament players clicking Ready nearly simultaneously and profiled it locally with:
go test -run TestLargeTournamentProfile -memprofile mem.out -cpuprofile cpu.out
I wanted to make sure the issue was actually what I thought it was. Something didn’t seem quite right, especially with the fact that the DB bandwidth was so high during these tournament round starts. Also, why was this happening now? We’d held 90+ people tournaments in the past and had not noticed these spikes.
The profile was somewhat inconclusive. The easiest way to visualize these output files is to do go tool pprof cpu.out, for example, and type in png in the command line. You can then view the call graph. The memory profile contains allocations; I could see that with my 200 tournament players I was allocating about 150 MB. Not a trivial amount, but with 2 GB of memory for this process and such a large tournament, it didn’t seem right that it would kill our system; our actual tournament was smaller and people weren’t clicking Ready at the same time.
Profiling on production
Go lets you profile directly on the production server with the right paths. If you just import "net/http/pprof" at the top of your file, an HTTP server will automatically be registered for you. Since I already was using an HTTP server for my app, I added the paths manually as such:
    router := http.NewServeMux()

    // some other routes here

    router.Handle("/debug/pprof/", http.HandlerFunc(pprof.Index))
	router.Handle(
		"/debug/pprof/profile", http.HandlerFunc(pprof.Profile))
	router.Handle(
		"/debug/pprof/trace", pprof.Handler("trace"),
	)
	router.Handle(
		"/debug/pprof/goroutine", pprof.Handler("goroutine"),
	)
	router.Handle(
		"/debug/pprof/heap", pprof.Handler("heap"),
	)
Make sure your write timeout is set to something fairly large:
	srv := &http.Server{
		Addr:         cfg.ListenAddr,
		Handler:      router,
		WriteTimeout: 30 * time.Second,
		ReadTimeout:  10 * time.Second}
This is needed so that you can run fairly long profiles. You can start a profile on the production server as such: go tool pprof localhost:8001/debug/pprof/profile?seconds=25. This assumes your HTTP server is listening on port 8001 of course. Make sure to not expose this port outside of your host! I SSHed directly into the ECS instance running my server in order to run the above profile.
You can then explore the top functions, for example:
(pprof) top10
Showing nodes accounting for 130ms, 54.17% of 240ms total
Showing top 10 nodes out of 198
      flat  flat%   sum%        cum   cum%
      30ms 12.50% 12.50%       30ms 12.50%  syscall.Syscall
      20ms  8.33% 20.83%       20ms  8.33%  runtime.nextFreeFast
      10ms  4.17% 25.00%       10ms  4.17%  context.Background
      10ms  4.17% 29.17%       60ms 25.00%  encoding/json.(*decodeState).object
      10ms  4.17% 33.33%       20ms  8.33%  encoding/json.checkValid
      10ms  4.17% 37.50%       10ms  4.17%  encoding/json.stateBeginValue
      10ms  4.17% 41.67%       10ms  4.17%  encoding/json.stateInString
      10ms  4.17% 45.83%       10ms  4.17%  indexbytebody
      10ms  4.17% 50.00%       10ms  4.17%  reflect.Value.Elem
      10ms  4.17% 54.17%       10ms  4.17%  reflect.Value.Kind (inline)
Nothing too out of the ordinary here, but it’s good to have a baseline. You can also run a heap profile by changing the url to /debug/pprof/heap so that you can see allocations. I figured the CPU profile would help here as the problem started out by manifesting itself as CPU spikes mainly.
Waiting for a tourney
Woogles hosts multiple tourneys a week; mainly run by club directors wanting to run competitions for their club members during the pandemic. As I was puzzling over this problem I noticed a tournament was running for the Madison, WI club, so I contacted the director and asked her if she could please send me a message right before she starts the next round. I collected a couple more baselines in the meantime, and she happily obliged. I collected another profile as the round was starting, and then a couple more at the end. Although each profile only collects a sample of all calls, I figured I should be able to see something. The server stops 100 times a second to collect information about what is executing, so it’s not necessarily super resource friendly.
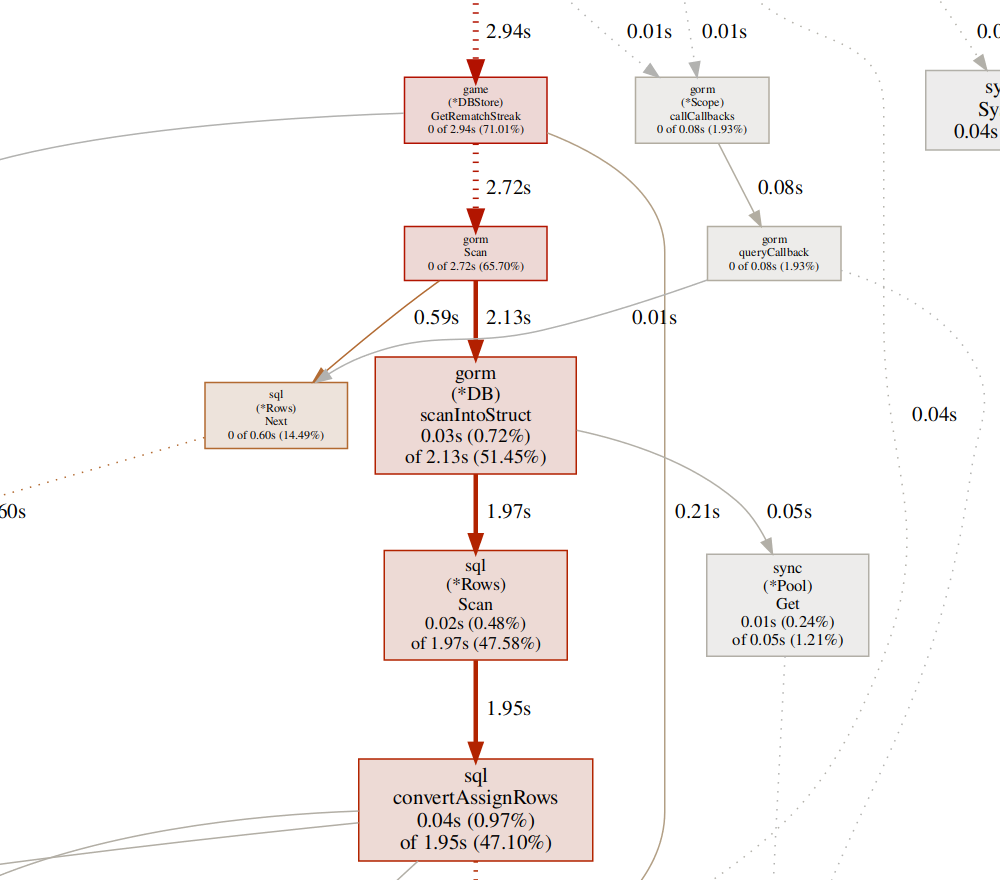
Examining the profile as she started the next round I expected to see heavy JSON parsing centered mainly around the tournament module. And I did see heavy JSON parsing, but it was from an unexpected source:
(pprof) top10
Showing nodes accounting for 2170ms, 52.42% of 4140ms total
Dropped 269 nodes (cum <= 20.70ms)
Showing top 10 nodes out of 173
      flat  flat%   sum%        cum   cum%
     390ms  9.42%  9.42%      840ms 20.29%  encoding/json.(*decodeState).skip
     360ms  8.70% 18.12%      790ms 19.08%  encoding/json.checkValid
     310ms  7.49% 25.60%      330ms  7.97%  encoding/json.stateInString
     310ms  7.49% 33.09%      330ms  7.97%  syscall.Syscall
     170ms  4.11% 37.20%      470ms 11.35%  runtime.scanobject
     150ms  3.62% 40.82%      150ms  3.62%  runtime.epollwait
     130ms  3.14% 43.96%      170ms  4.11%  runtime.findObject
     120ms  2.90% 46.86%      210ms  5.07%  encoding/json.stateEndValue
     120ms  2.90% 49.76%      120ms  2.90%  runtime.memclrNoHeapPointers
     110ms  2.66% 52.42%      440ms 10.63%  runtime.mallocgc

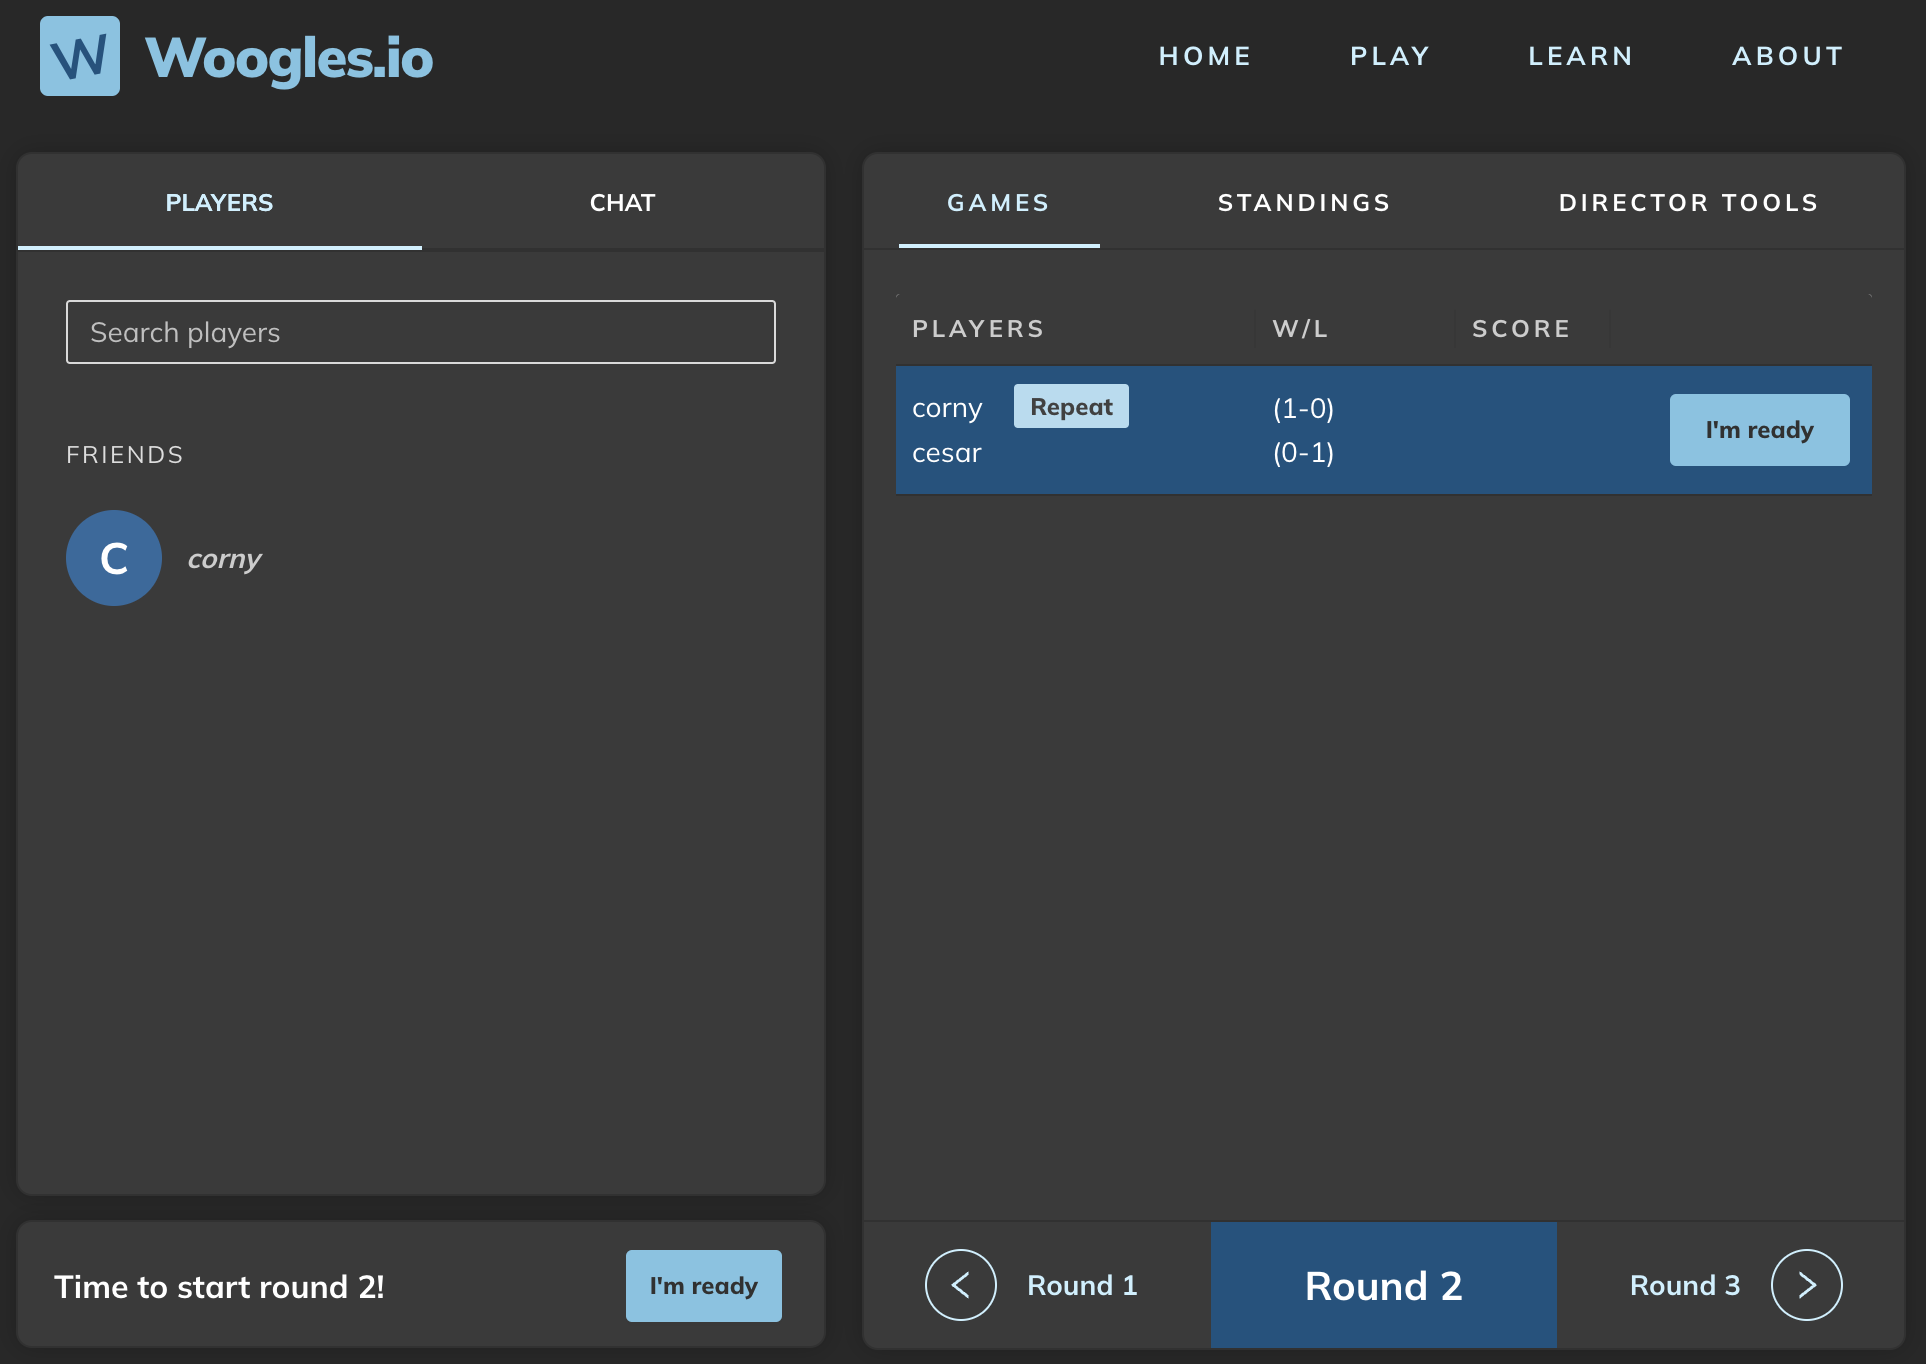
The box at the top is called “GetRematchStreak”. In woogles, whenever a new game starts, a function GetRematchStreak is called that gets the streak for two players; for example, player 1 has beaten player 2 10 times in a row. It is used to render widgets like this:

It is also used to tell people watching the previous game that a new round has started. There are more efficient ways of doing this latter task, but chalk this up to tech debt we have not fixed yet. However, tournament games don’t have rematch streaks. There is an ID the code uses to find a rematch streak - it is the “request ID” of the game – but tournament games do not generate request IDs.
Furthermore, the code to get rematch streak looks like:
func (s *DBStore) GetRematchStreak(ctx context.Context,
    originalRequestId string) (*gs.StreakInfoResponse, error) {
	games := []*game{}
	ctxDB := s.db.WithContext(ctx)
	if results := s.db.
		Where("quickdata->>'o' = ? AND game_end_reason not in (?, ?, ?)",
			originalRequestId,
            pb.GameEndReason_NONE,
            pb.GameEndReason_ABORTED,
            pb.GameEndReason_CANCELLED).
		Order("created_at desc").
		Find(&games); results.Error != nil {
		return nil, results.Error
    }

	resp := &gs.StreakInfoResponse{
		Streak: make([]*gs.StreakInfoResponse_SingleGameInfo, len(games)),
	}

	if result.RowsAffected <= 0 {
		return resp, nil
	}

	for idx, g := range games {
		var mdata entity.Quickdata
		err := json.Unmarshal(g.Quickdata, &mdata)

        // etc ...
    }
    // etc...
So since there is no originalRequestId, this function is getting called with an empty string "" and is therefore pulling data for ALL previous tournament games (which also have an empty string as an original request ID). This is close to 15K tournament games at the time of writing this. Every time any tournament game started, the code was pulling 15K tournament games out of the database (note also that all columns are being selected, even though I only need a couple of small columns). All 15K tournament games are being sent across the wire to a function that then creates a giant slice of them, parses 15K JSON blobs, and so on. Imagine what happens when 30+ tournament games start in rapid succession.
This bug is easy to fix; don’t call this function if the originalRequestId is blank. I additionally optimized the query a little bit to send less data.
Lessons
Some lessons I learned here:
-
Check my assumptions. I was about to do a complicated refactor and would still have had the same issue.
-
Pay more attention to the diagnostics I’ve already collected. The fact that the database server was sending so much data, and that the problem was getting worse over time, should have indicated that it had to do with a growing database.
-
Try to run tests on systems that simulate production environments. I should have been able to replicate this issue with my 200-player profiling test if I had loaded a production database dump into my test machine.
-
Read the code. It is possible to find this bug without profiling. But admittedly, this is a complex project with a large codebase.
-
go tool pprofis super powerful! This only scratches the surface of what it can do. I’ve used it in the past to find specific lines of code where the bulk of the time is being spent.
Open-source
If you like open-source projects and/or Scrabble and want to contribute some code please get in touch! You can check out our Discord server.